Infographic: Here Comes Halloween!
By Inspira Marketing
October 23, 2019
By Inspira Marketing
October 23, 2019
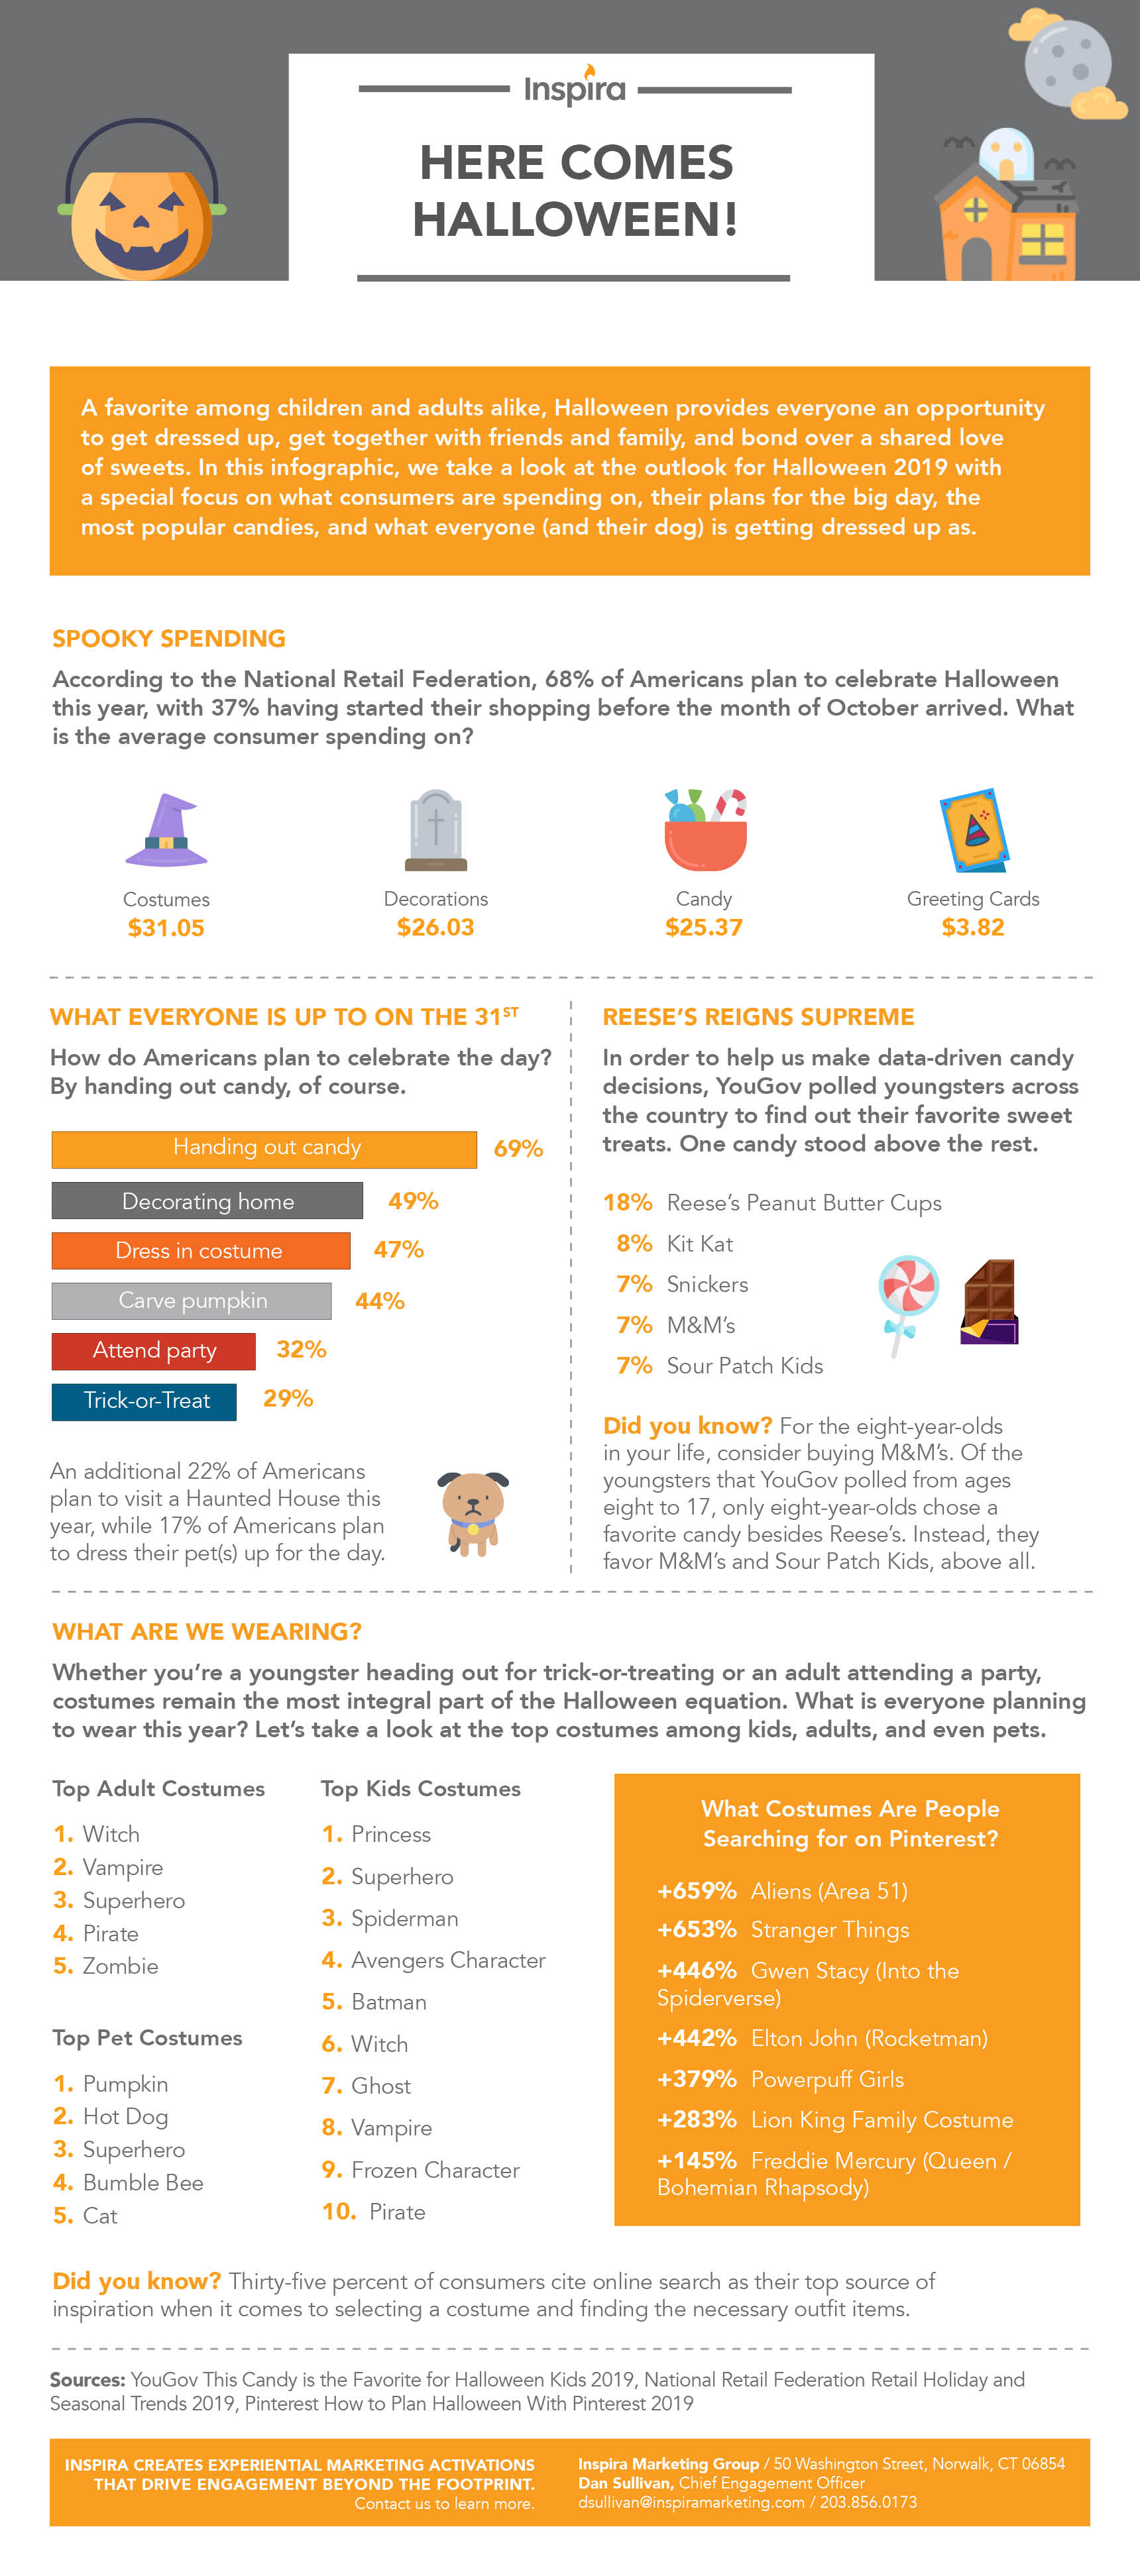
A favorite among children and adults alike, Halloween provides everyone an opportunity to get dressed up, get together with friends and family, and bond over a shared love of sweets. In this infographic, we take a glimpse at the outlook for Halloween 2019 with a special focus on what consumers are spending on, their plans for the big day, the most popular candies, and what everyone (and their dog) is getting dressed up as.
Here are three things you need to know about consumers and their preparation for Halloween this year:
Spooky Spending
According to the National Retail Federation, 68% of Americans plan to celebrate Halloween this year, with 37% having started their shopping before the month of October arrived. What is the average consumer spending on?
What Everyone is Up to on the 31st?
How do Americans plan to celebrate the day? By handing out candy, of course.
Reese’s Reigns Supreme
In order to help us make data-driven candy decisions, YouGov polled youngsters across the country to find out their favorite sweet treats. One candy stood above the rest.
Is your brand looking connect with consumers this holiday season? Contact us today to learn how our suite of experiential-led services can help you build brand awareness, encourage product trial, and earn lifelong loyalists.