Infographic: How Americans Prepare for the Big Game
By Inspira Marketing
January 30, 2019
By Inspira Marketing
January 30, 2019
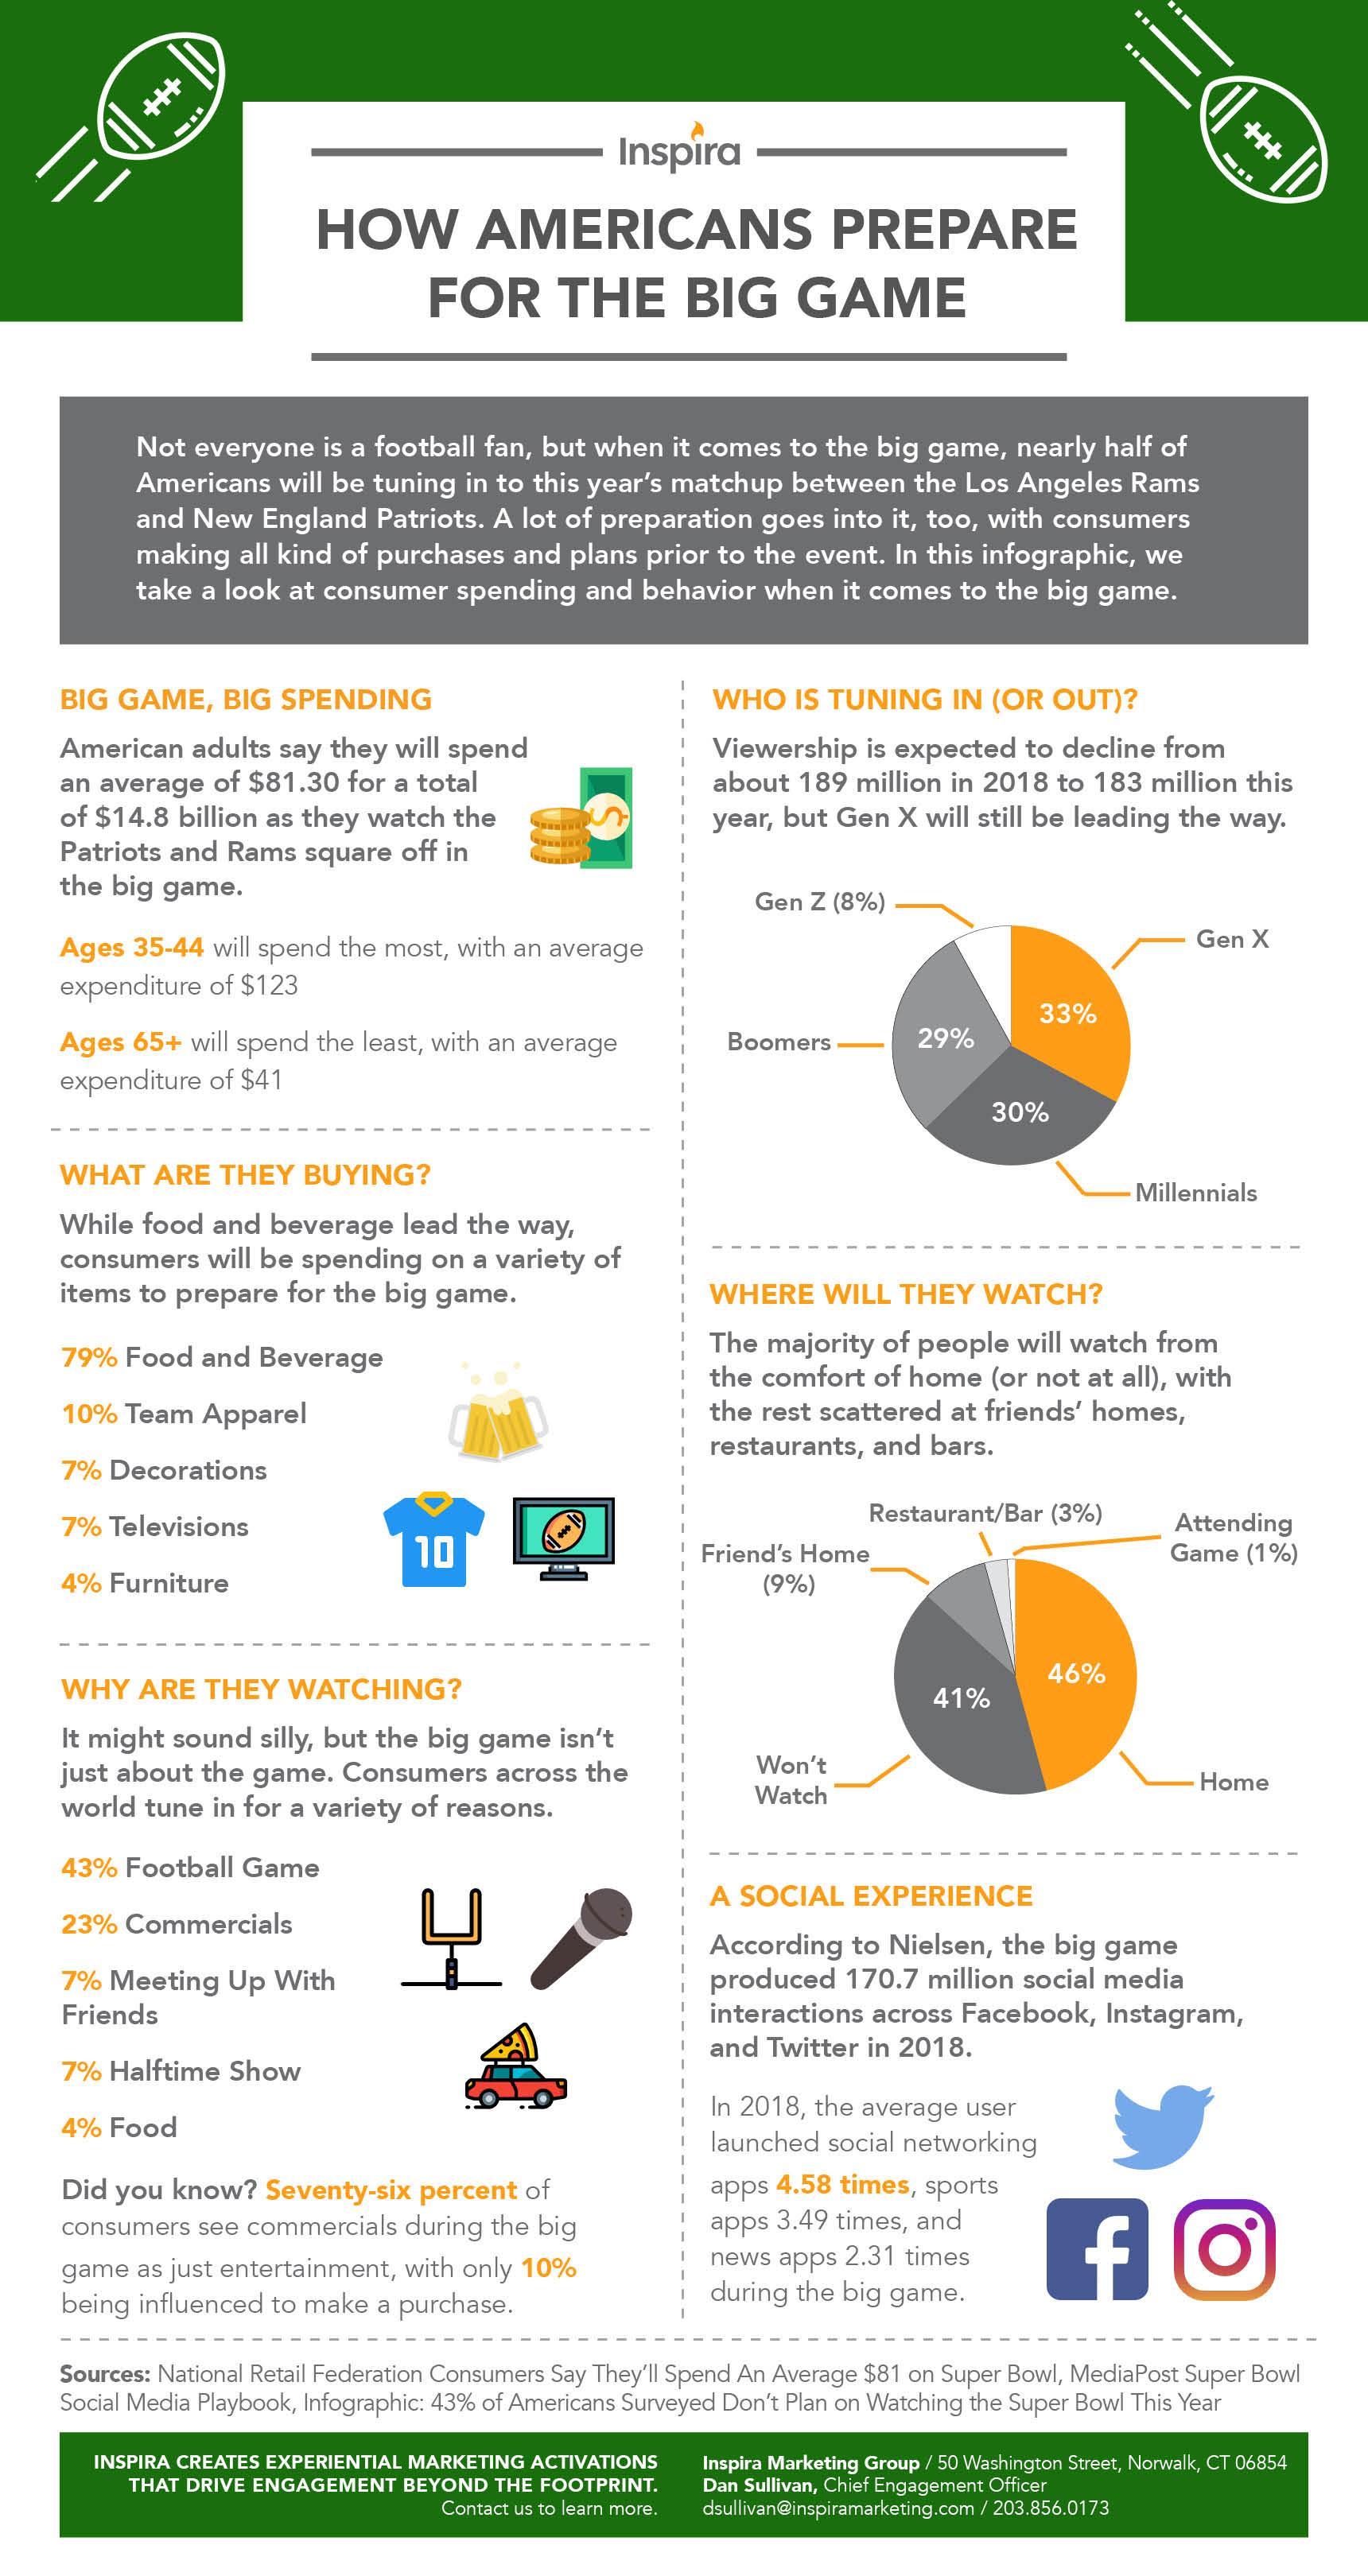
Not everyone is a football fan, but when it comes to the big game, nearly half of Americans will be tuning in to this year’s matchup between the Los Angeles Rams and New England Patriots. A lot of preparation goes into it, too, with consumers making all kinds of purchases and plans prior to the event. In this infographic, we take a look at consumer spending and behavior when it comes to the big game.
Here are six facts you need to know about consumer behavior when it comes to the big game:
Big Game, Big Spending
American adults say they will spend an average of $81.30 for a total of $14.8 billion as they watch the Patriots and Rams square off in the big game.
Ages 35-44 will spend the most, with an average expenditure of $123
Ages 65+ will spend the least, with an average expenditure of $41
What Are They Buying?
79% Food and Beverage
10% Team Apparel
7% Decorations
7% Televisions
4% Furniture
Why Are They Watching?
43% Football Game
23% Commercials
7% Meeting Up With Friends
7% Halftime Show
4% Food
Who Is Tuning In (Or Out?)
Gen X 33%
Millennials 30%
Boomers 29%
Gen Z 8%
Where Will They Watch?
46% Home
41% Won’t Watch
9% Friend’s Home
3% Restaurant / Bar
1% Attending Game
A Social Experience
In 2018, the average user launched social networking apps 4.58 times, sports apps 3.49 times, and news apps 2.31 times during the big game.
Looking to use the big game to build awareness for your brand? Contact us today to learn how our suite of experiential marketing services can help build long-lasting, meaningful connections with football fans across the country.