Infographic: The Brand Preferences of Gen Z Genesis vs. Millennial Michael
By Bobby Johnson
December 20, 2022
By Bobby Johnson
December 20, 2022
We take a look at the brand preferences of your average Gen Zer and your average Millennial, and compare how they stack up, what they’re looking for in a brand, and how much trust they have for the brands they engage with.

Infographic: Gen Z Genesis vs Millennial Michael
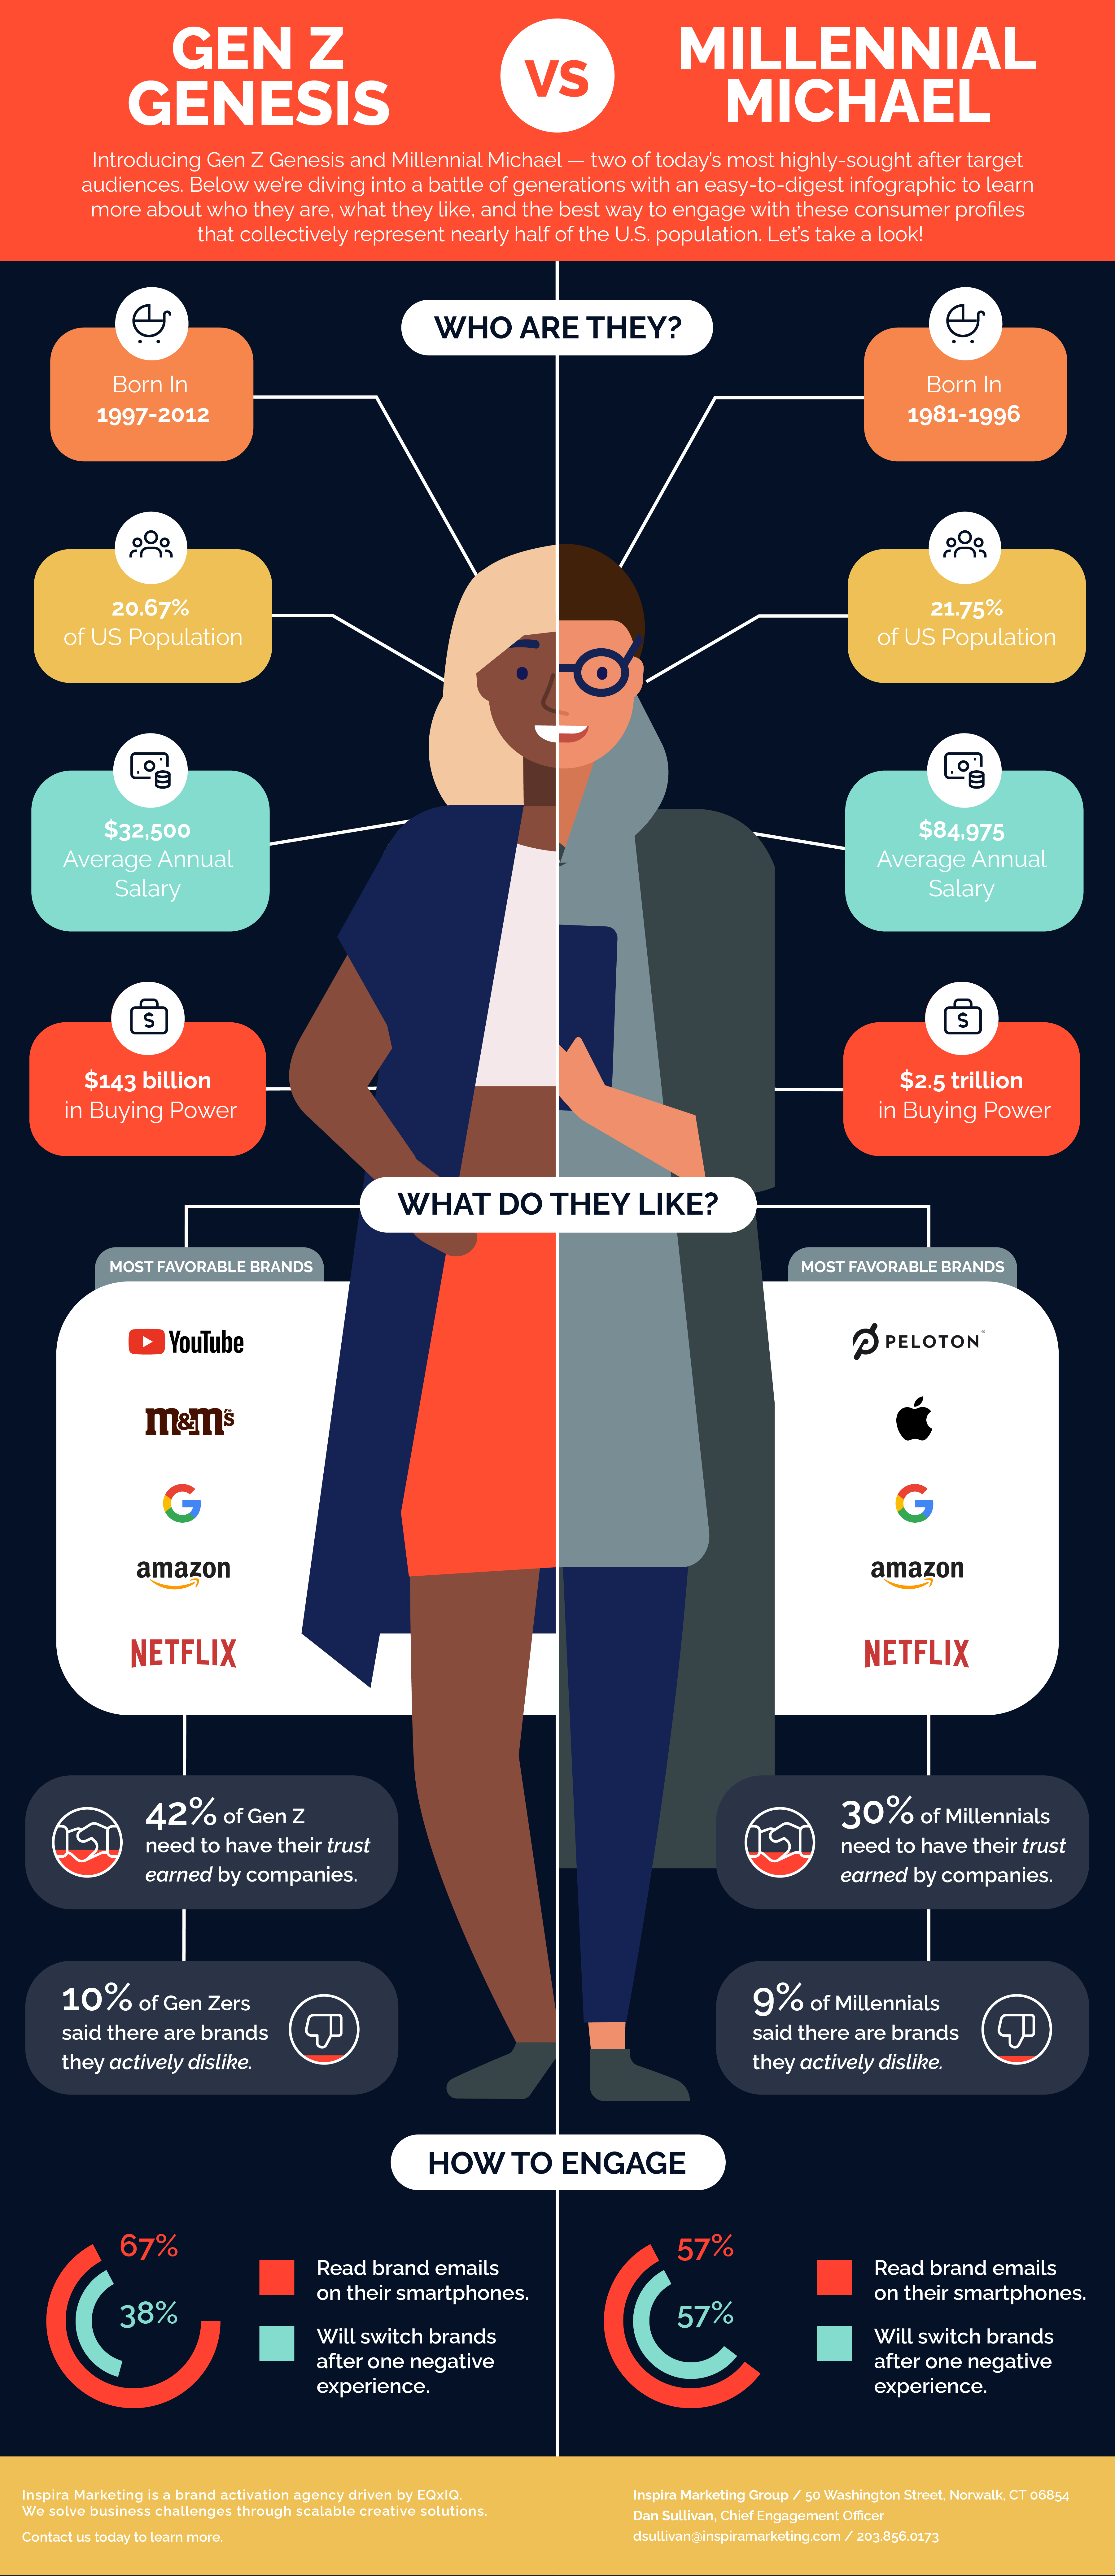
Introducing Gen Z Genesis and Millennial Michael — two of today’s most highly-sought after target audiences. Below we’re diving into a battle of generations with an easy-to-digest infographic to learn more about who they are, what they like, the best way to engage (plus what not to do!) with these consumer profiles that collectively represent nearly half of the U.S. population. Let’s take a look!
Genesis is your average Gen Zer, born between 1997 and 2012. She represents over 68 million people, a fifth of the entire US population. She’s young, still working out her job and career trajectory, and makes around $32,500.
Michael represents the Millennial generation, and he was born between 1981 and 1996. His generation makes up around 22% of the United States population, at 72 million. He’s in the prime of his career, he’s raising a family, and he’s making around $85,000 a year.
Together, Genesis and Michael represent nearly half of the population of the US.
When it comes to brands, Genesis loves tech companies that produce consistent and entertaining content. And candy, apparently. YouTube, Google, Netflix, Amazon, and M&M’s make up her top five. However, Genesis isn’t easy to win over and has more negative feelings towards brands than every other generation. She also has less trust in brands and believes trust has to be earned.
Michael’s favorite brands are a little more varied, but tech is still in the lead. His top five brands include Peloton, Amazon, Google, Netflix, and Apple. Michael has the most fuzzy feelings for brands compared to every other generation. He also trusts brands slightly more than Genesis, but less than Gen Xers and Boomers do.
Gen Z Genesis prefers to engage with brands via email, and she reads those emails on her smartphone. But if you want to keep Genesis around as a customer, you’re going to have to limit the negative experiences she has with your brand: she’s likely to switch brand loyalty after even a single bad interaction.
Millennial Michael is pretty similar to Genesis when it comes to brand engagement, preferring to communicate via email. However, he only reads those emails on his smartphone about half the time, relying on desktops and laptops as a close second choice. When it comes to brand loyalty, Michael shows the lowest of all generations, and he’s far more likely than even Genesis to drop a brand after one negative experience.
How can you tell a Gen Zer from a Millennial?
How big are the Gen Z and Millennial generations?
How much money do Gen Zers and Millennials control?
Tech and media brands are in the lead
Gen Z and Millennials aren’t as easy to win over
Gen Z and Millennials trust brands less than other generations
Email is still in the lead
Brand loyalty requires sustained excellence