Infographic: Meet the Experience Enhancers
By Inspira Marketing
June 30, 2020
By Inspira Marketing
June 30, 2020
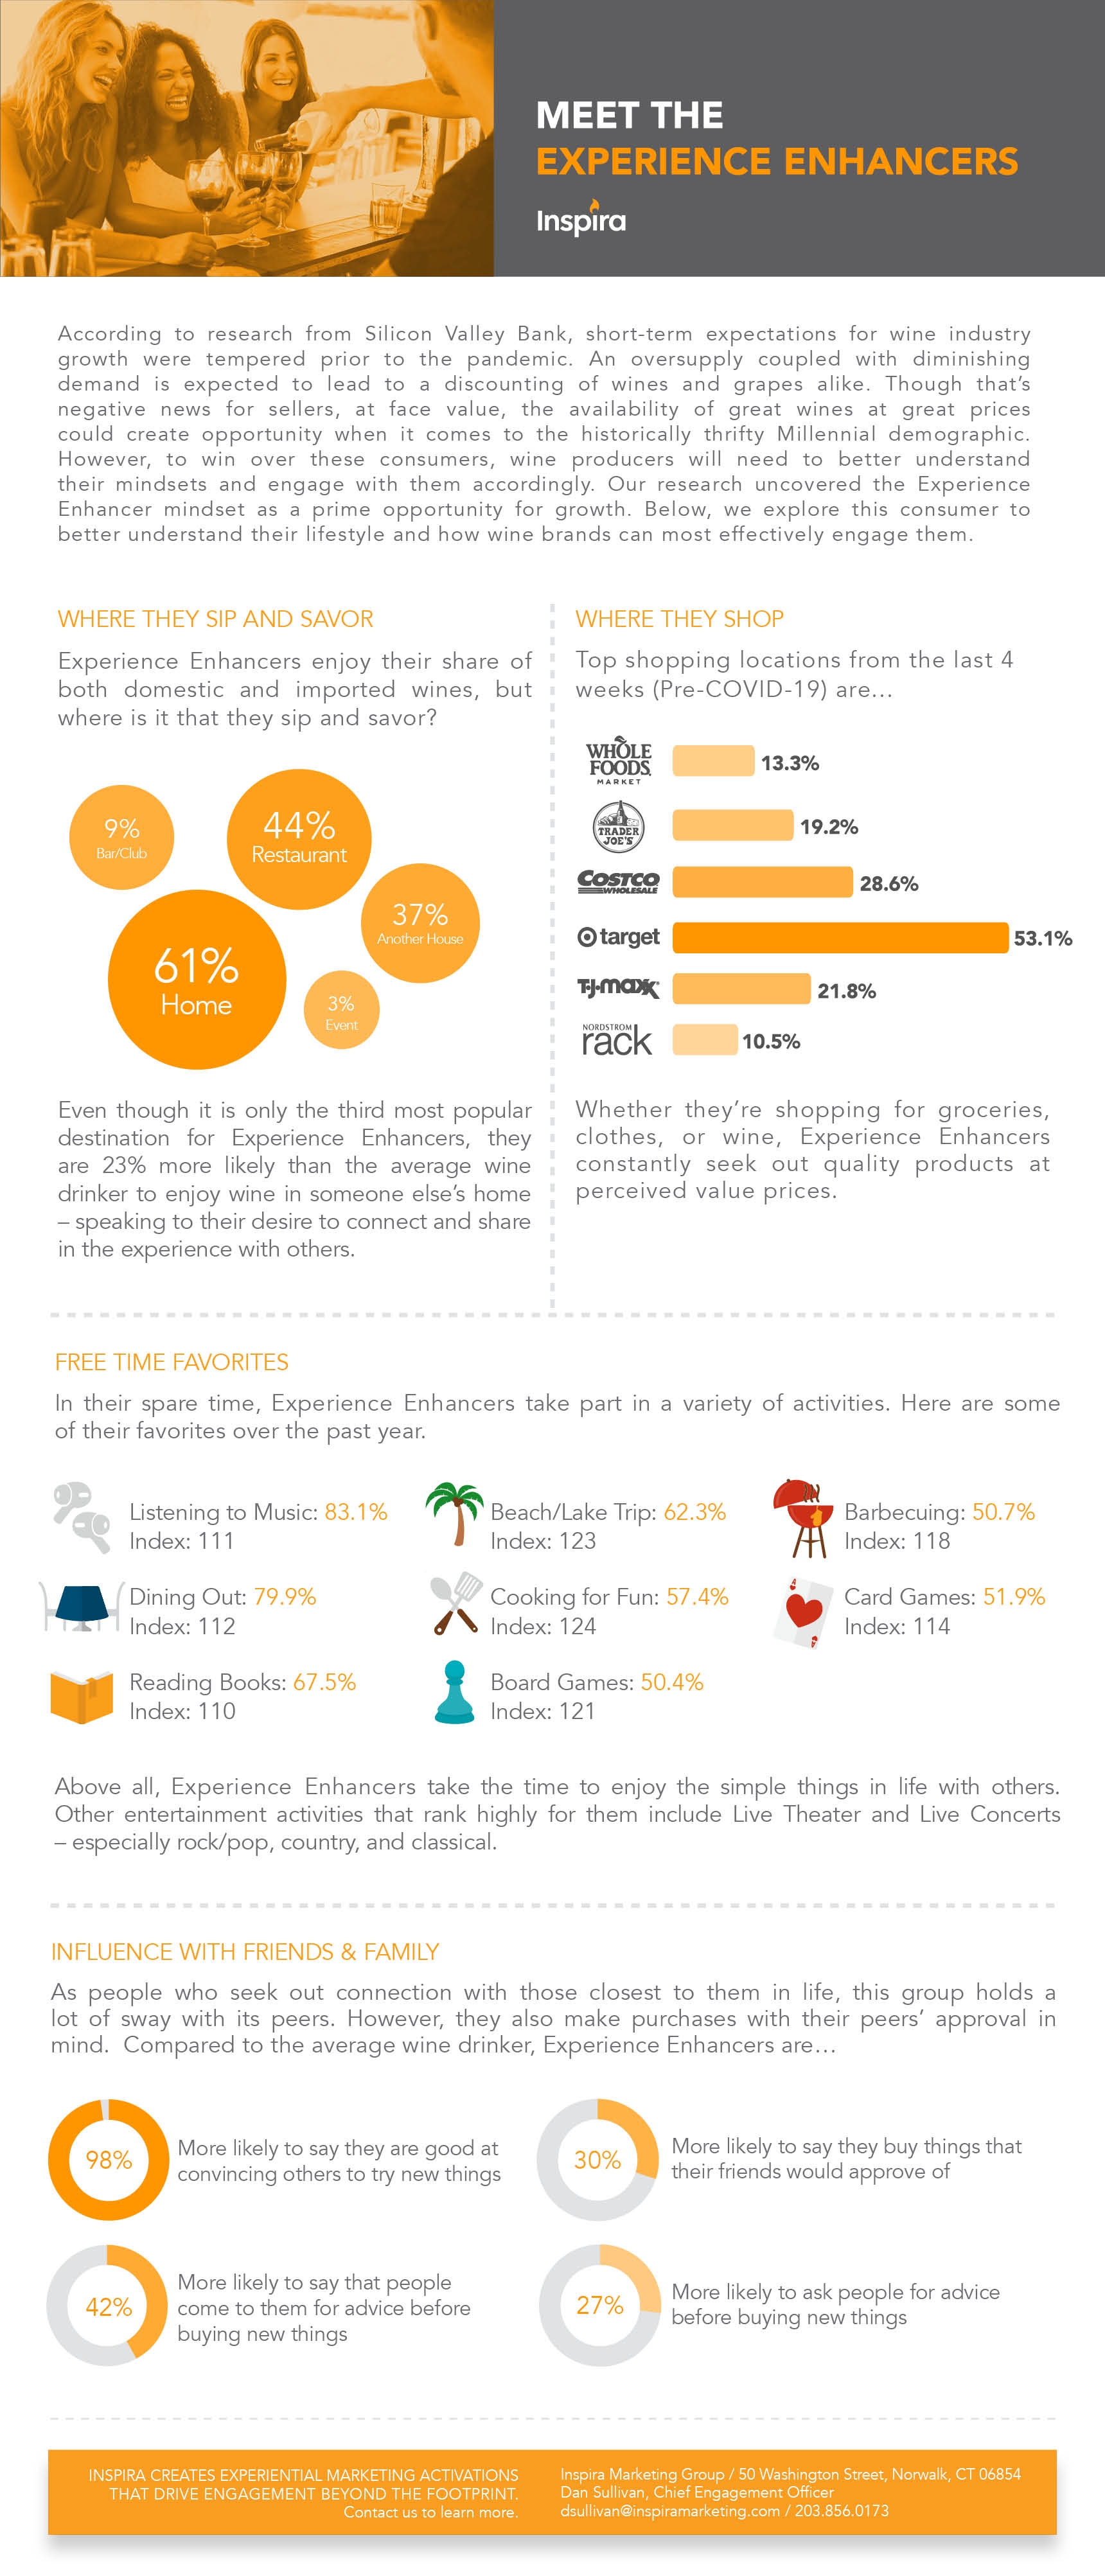
According to research from Silicon Valley Bank, short-term expectations for wine industry growth were tempered prior to the pandemic. An oversupply coupled with diminishing demand is expected to lead to a discounting of wines and grapes alike. Though that’s negative news for sellers, at face value, the availability of great wines at great prices could create opportunity when it comes to the historically thrifty Millennial demographic. However, to win over these consumers, wine producers will need to better understand their mindsets and engage with them accordingly. Our research uncovered the Experience Enhancer mindset as a prime opportunity for growth. Below, we explore this consumer to better understand their lifestyle and how wine brands can most effectively engage them.
Here are four things you need to know about the Experience Enhancers:
Where They Sip and Savor
Experience Enhancers enjoy their fair share of both domestic and imported wines, but where is it that they sip and savor?
|
Consumed Last 30 Days (Pre-COVID-19) |
Percentage |
Index |
|
Home |
60.8% |
113 |
|
Restaurant |
43.8% |
119 |
|
Someone Else’s Home |
36.8% |
123 |
|
Bar/Club |
9.9% |
123 |
|
Entertainment/Sporting Event |
3.3% |
113 |
While it’s only the third most popular destination for Experience Enhancers, they’re 23% more likely than the average wine drinker to enjoy wine in someone else’s home – speaking to their desire to connect and share in the experience with others.
Where they Shop
|
Shopped Last 4 Weeks (Pre-COVID-19) |
Category |
Percentage |
Index |
|
Whole Foods |
Grocery |
13.3% |
140 |
|
Trader Joe’s |
Grocery |
19.2% |
124 |
|
Costco |
Grocery |
28.6% |
118 |
|
Target |
Retail |
53.1% |
117 |
|
Nordstrom Rack |
Retail |
10.5% |
122 |
|
TJ Maxx |
Retail |
21.8% |
124 |
Whether they’re shopping for groceries, clothes, or wine,Experience Enhancers are constantly seeking out quality products at perceived value prices.
Free Time Favorites
In their spare time,Experience Enhancers take part in a variety of activities. Here are some of their favorites over the past year.
|
Leisure Activities (Past 12 Months) |
Percentage |
Index |
|
Listening to Music |
83.1% |
111 |
|
Dining Out |
79.9% |
112 |
|
Reading Books |
67.5% |
110 |
|
Going to the Beach / Lake |
62.3% |
123 |
|
Cooking for Fun |
57.4% |
124 |
|
Card Games |
51.9% |
114 |
|
Barbecuing |
50.7% |
118 |
|
Board Games |
50.4% |
121 |
Above all,Experience Enhancers take the time to enjoy the simple things in life with others. Other entertainment activities that rank highly for them include Live Theater and Live Concerts – especially rock/pop, country, and classical.
Influence with Friends and Family
As people who seek out connection with those closest to them in life, this group holds a lot of sway with its peers. However, they also make purchase decisions with their peers’ approval in mind. Compared to the average wine drinker, Experience Enhancers are…